Modeling H. pylori using ENISI and Cell Designer
Updated on December 29th 2012: The ENISI model has been progressed in the following two areas: Sensitivity Analysis and Cell Movement Modeling.
To further characterize the immunological mechanisms underlying mucosal immune responses to H. pylori in a stochastic system, we used ABM based on parameter values derived from our ODE model. When probabilistic approaches are used, the complex immunological processes can be better represented. We adopted the ABM tool ENteric Immune Simulator (ENISI) developed by us and available here.
In this case, a stochastic Agent Based Modeling approach has been used to better represent the biological system and add a complementary view on the cascade after infection. ABM adds randomness to the biological systems, which can help to better represent complex cellular responses and to take into account the individual behaviors of cells as well as the role spatiotemporal features. Thus, stochastic models can provide novel insights into the effect of cognate and non-cognate interactions, representing entire systems with a greater granularity and capturing cell-cell interactions. By simulating individual behaviors of agents, ABM better represents cross-linked, complex and nonlinear processes with multiple feedback loops and, provides a more comprehensive and interactive modeling of mucosal immune responses to H. pylori. The ability of ABM to encompass multiple scales of biological processes and incorporate spatiotemporal considerations, coupled with an intuitive modeling paradigm, underscores the added value of this modeling framework in translational systems immunology and immunoinformatics research.
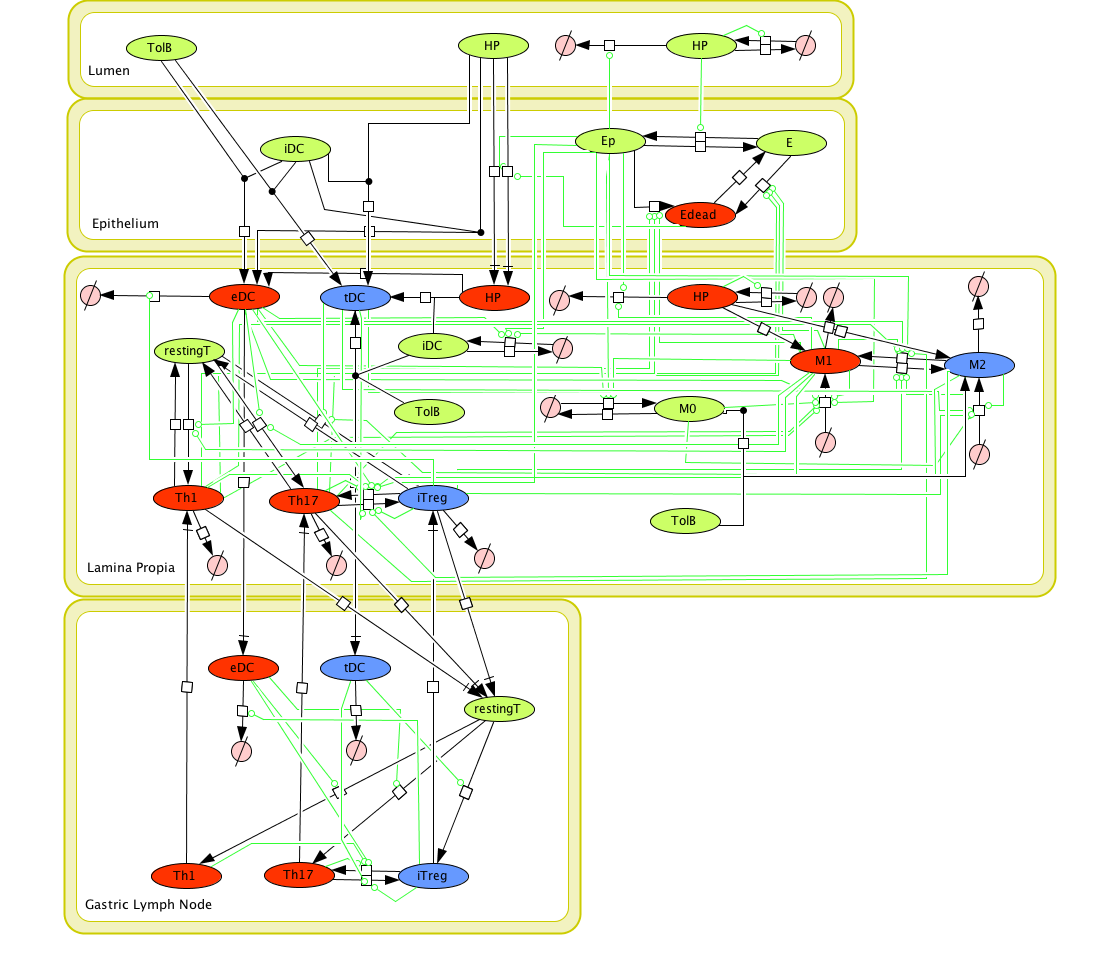
Given the complexity, nonlinearity and abundance of feedback loops in mucosal immune responses to H. pylori and to facilitate a better understanding of the mechanisms underlying such immune responses at the systems level, we constructed a SBML network model depicting the major effector and regulatory pathways evoked during H. pylori infection (Figure 1). Three different compartments are represented: gastric lumen, epithelium and lamina propria. Effector subsets are highlighted in red whereas regulatory subsets are highlighted in blue.
Some updates on the HP ENISI model contain:
- New states of bacteria have been added which incorporates alive, dead and resting bacteria.
- The lifetime of each cell has been modified. Now each cell has a lifetime with normal distribution with a mean and standard deviation.
- We have changed the model parameters to adequate the model to different scenarios of experimental interest. Those scenarios can be accessed here.
- We have reduced some unnecessary states that were not needed in the system.
- We have created a generator application that creates the initial simulation files. This application has been updated with the additional initial states.
The model is available for download in CellDesigner xml format (right click the link or ctrl+left click for Mac machines to save the model source file). We have tested that the model is compatible with Cell Designer 4.2.
The primary MIEP team members responsible for maintaining this model are Maksudul Alam, Adria Carbo and Yongguo Mei at the Virginia Bioinformatics Institute. Please contact them with any questions or comments.
(Click on the image for a user-friendly interactive CellPublisher model.)
Sensitivity analysis studies the effect of different parameters in the output of a system. It has been used in many scientific fields to highlight important data, optimize the design of a system, and rank the influence of various parameters on the system.
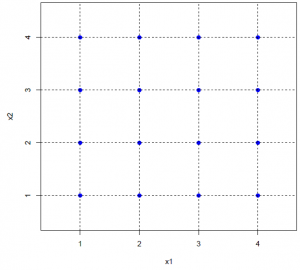
The primary goal of sensitivity analysis is to find out which modeling parameter has the biggest impact on the system and what causes the effect. Both mono-factorial and multi-factorial sensitivity analyses have been performed. ENISI has a set of 25 independent modeling parameters, four different values from each are selected for the sensitivity analysis. Our experimental design follows statistical design methods. As an example, in the multi-factorial experiments, we performed only 128 different experiments of different parameter combinations. However when projecting onto any two variables (i.e., any two columns of the design matrix), it is a full factorial (4 times 4) with 8 replications for each level combination. See following figure for illustration.
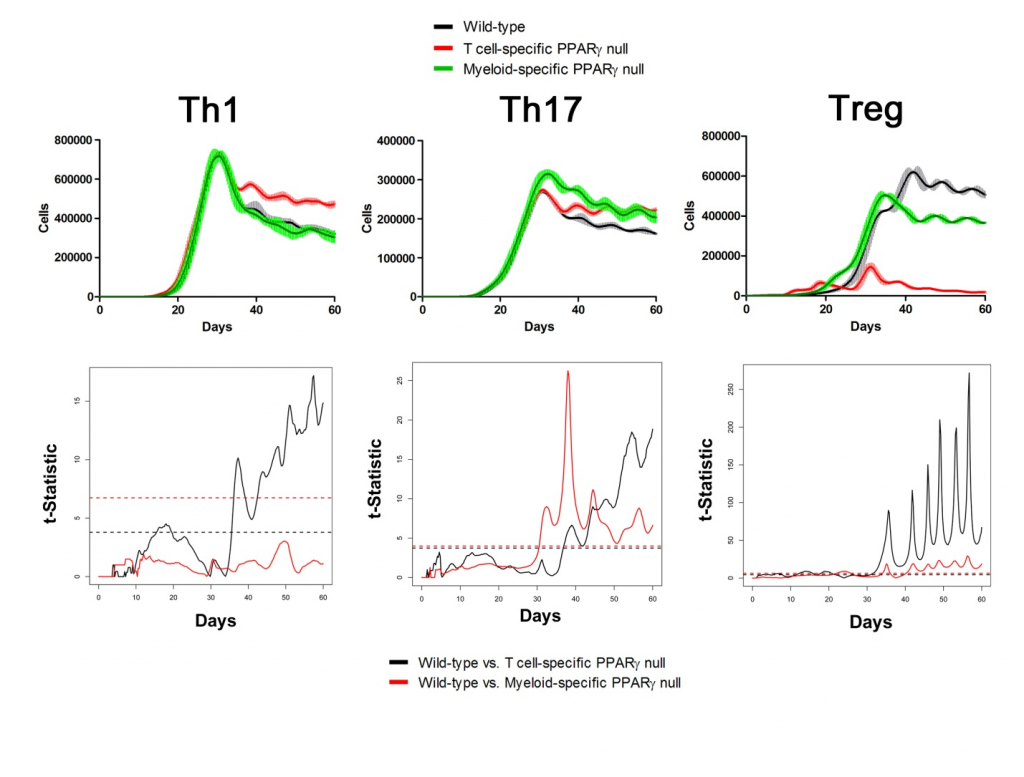
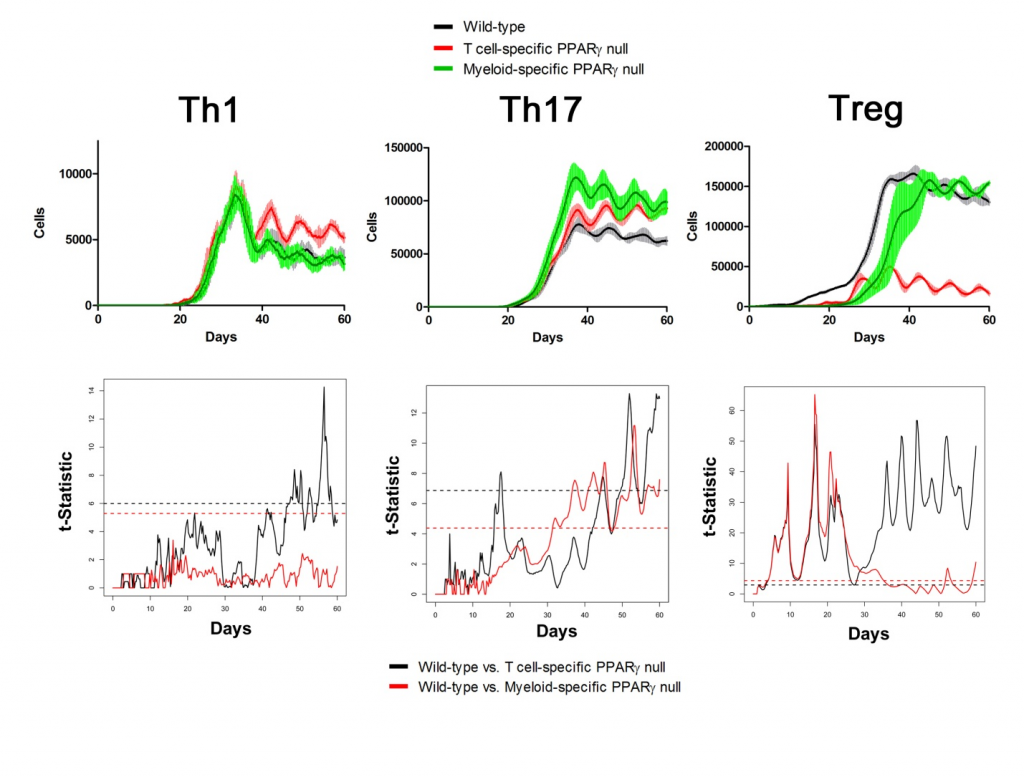
Sensitivity analysis helps identify appropriate parameters for in silico experiments. The following two figures show the time series of different cell types in Lamina Propria and Gastric Lymph nodes with parameters tuned and model calibrated after sensitivity analysis. In the simulations, three scenarios have been performed and compared: wild type, T Cell-specific PPAR γ null and Myeloid-specific PPAR γ null. Functional t-statistics has been performed as shown in the lower sets of sub-figures in both figures.
Lamina Propria
Gastric Lymph Nodes
We have been designing the cellular movement in ENISI. Two types of movements are considered here: Brownian movement and chemotaxis. Brownian movement is the movement which is inherent property of a cell. The chemotaxis movement depends on chemokine concentration in a tissue site. In ENISI we are adopting the discrete cellular movement.
Brownian movement:
In ENISI we would compute the discrete Brownian movement in terms of prior probability. For each cell phenotype we compute the probability that the cell would move to the adjacent cell in the next step. We pick a neighboring cell from this probability distribution.
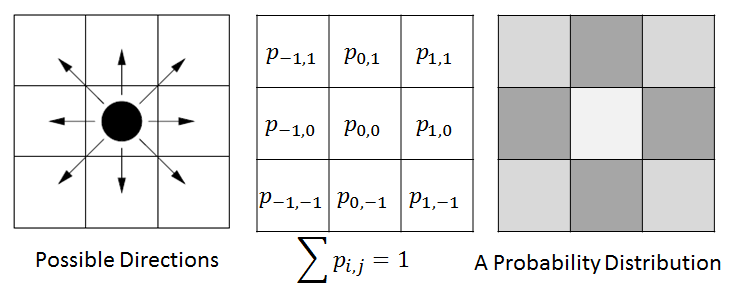
For example, in the above figure we have shown illustration for a 2D cellular movement. A cell can move to 8 possible direction or stay in its original location. These probabilities are shown in the middle figure. The last figure shows the probability in greyscale. A cell will move randomly with this probability distribution. The actual probability distribution for the cells will be derived from literature.
Chemokine movement:
Chemotaxis is the phenomenon in which cells or multicellular organisms direct their movements according to certain chemicals (chemokines) in their environment. Chemokine is the cytokine that has the ability to induce chemotaxis. There are four classes of chemokines: CC, CXC, C and CX3C. Though chemokine concentration is a continuous entity, in ENISI we treat chemokine concentration as discrete value at each sub-location. In our Chemokine movement mode, we consider the production, consumption, diffusion, and degradation.
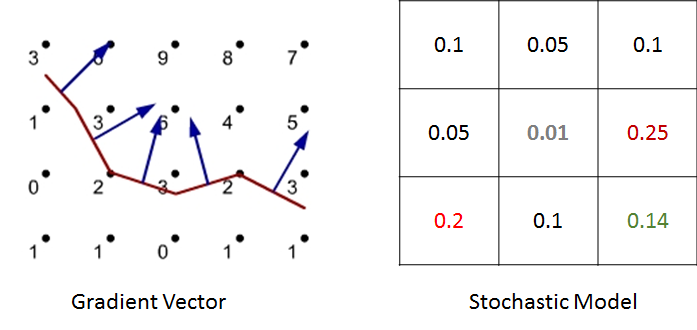
We have studied two models for chemokine dependent movement. First approach is deterministic gradient model. Here, we compute the chemokine gradient and follow the direction of the gradient. For a given chemokine concentration in the cellular sites, it computes a specific direction. The second approach is a stochastic model. The direction of the movement is probabilistically chosen based on the chemokine concentration of the neighboring cells and the probabilities are calculated based upon both the chemokine gradient.
