Highlights
- To create computational models and simulate immunological processes, NIMML has developed ENISI Suite, a group of web-based simulators used to visualize immune responses and to model deterministic and stochastic processes.
- Complex Pathway Simulator provides a platform to simulate immunological processes and biochemical reactions, as well as calculate sensitivities and perform parameter estimation with experimental data.
- NIMML has also modified an instance of a open source laboratory information management system (i.e., LabKey). By using LabKey, we are able to efficiently organize, analyze and import in real time our modeling and experimental data in a user-friendly way.
- As part of the sequencing pipeline, GALAXY® works with our high-performance computing (HPC) cluster and is used to analyze our experimental RNAseq data.
- NIMML is working on the development of user-friendly multiscale modeling hybrid platforms for assessing sensitivities across spatiotemporal scales.
Ongoing Efforts
Computational immunology, or immunoinformatics, has emerged as a powerful tool to quantitatively understand the dynamics of complex immunological systems. The analytics and modeling tools developed by the NIMML/MIEP teams help process, visualize and simulate complex datasets.
The mouse management system of the Nutritional Immunology and Molecular Medicine Laboratory (NIMML)
In MIEP we start the model development process with the creation of an interaction network which depicts the components (variables) of the model and their interaction and transformations graphically. The tool we use for the graphical representation of the is CellDesigner. CellDesigner is an easy to use graphical tool which is designed to create networks of biological interactions. The resulting graphical networks are understandable by experimentalists and mathematical modelers alike. Thus CellDesigner is facilitating the communication between the different team members. Another reason why we choose CellDesigener is its capability to save the network in the Systems Biology Markup Language (SBML), which allows us to easily move the model between a large set of tools. The knowledge for creating the interaction network is a comprised of the expertise of the team members with domain knowledge, literature research and experimental results.
About
The ENteric Immunity Simulator (ENISI) is a simulator of the gastrointestinal (GI) tract mucosal immune responses created for generating and testing hypothesis of mechanisms of immune regulation in response to the presence of resident commensal or pathogenic bacteria. ENISI is an implementation of an agent-based model of individual mucosa-associated lymphoid tissue immune cells each endowed with a program for trafficking and differentiation according to their intrinsic properties, i.e. epithelial cells, dendritic cells, macrophages, T cells, and natural regulatory T cells (Treg). The internal programs specify movement among the epithelium, lamina propria, and blood in response to inflammation-inducing pathogens and tolerance-inducing commensal bacteria. The model focuses on the antagonistic relationship between inflammatory and regulatory (anti-inflammatory) factors whose constant presence characterize mucosal tissue sites in general and gut mucosa in particular.
In its current stage, ENISI is capable of testing hypotheses to predict the net immune response to a pathogen given the complex interplay between both regulatory and inflammatory pathways. In addition, ENISI can be used to identify aspects of competing immune pathways that could likely be manipulated, through pharmacological intervention for instance, to inhibit pathogen invasion, infection, and evolution.
Accurately predicting these outcomes in specific individual backgrounds sets the stage for modeling determinants of a successful infection (host susceptibility), the capacity of the host as an infectious carrier, and pathogen phenotype selection. These are all relevant to devising effective therapeutic approaches that intervene in microbial infection cycles and pathogenic functions.
Through user-manipulation of cell type-specific programs, ENISI allows one to observe the effects of phenotypic changes in individual cell-types, observed in vitro, at the tissue level. As such, it is a translational research tool that allows researcher to:
- Test plausibility of in vitro observed behavior as explanations for observations in vivo in situ,
- Propose behaviors not yet tested in vitro that could be plausible explanations for observations at the tissue level.
- Conduct low-cost, preliminary experiments of proposed interventions/ treatments.
- Indicate useful areas of research through identification of missing data necessary to address a specific hypothesis.
- Perform in silico experiments that help define the best experimental design for successful immunological outcomes.
The tool currently captures dynamics of four possible outcomes in response to pathogen exposure in the presence of tolerance-inducing microflora:
- Complete tolerance that leads to ongoing pathogenic microbe persistence.
- Hypo-inflammation in which a pathogen is not completely eliminated and persists chronically in the host.
- Inflammation that eliminates the microbe, but it ceases prior to extensive tissue damage.
- Hyper-inflammation in which the microbe is eliminated, but at expense of host tissue damage.
Simulation
Users may modify rules for agent behavior to create in silico experimental conditions by specifying any of the following features of the system:
- Infection specifics: dose and timing of pathogen entry
- Experimental host phenotypes: parameters governing interactions between specific phenotypes to represent changes in cytokine and cytokine-receptor expression
- Host immunological set-point: initial immune cell populations present at the time of infection
- Strain-specific functions of bacteria: specifications of interaction conditions and consequences for the three general strain-types represented, commensal bacteria, tolerogenic bacteria, or inflammatory bacteria such that their behavior mimics that observed in experimental strains.
The ENISI model includes 87 parameters that the user may control through a scripting language described in ENISI 0.9 documentation. Here we provide an interface that allows the user to observe the outcome of a simulated infection with the gastric pathogen Helicobacter pylori under hypothetical experimental conditions that have been pre-configured for past in silico studies.
- Naive wild type (WT) mouse: The only bacteria present in the GI tract are strains of the resident microflora that are assumed to be tolerogenic.
- H. pylori-infected WT mouse: The gastric mucosa of mouse is colonized with a pathogenic strain of the bacterium (i.e., 26695) carrying the cag pathogenicity island.
- H. pylori-infected myeloid cell-specific peroxisome proliferator-activated receptor (PPAR)γ-deficient mouse: The gastric mucosa of genetically modified mouse lacking PPARγ in myeloid cells (macrophages, dendritic cells and neutrophils) is colonized with H. pylori strain 26695. PPARγ is a nuclear receptor for endogenous lipids [i.e., prostaglandins or hydroxy-containing PUFA] that are produced during various homeostatic processes and has been shown to participate in a number of anti-inflammatory mechanisms including induction of anergy in inflammatory T-cells, enhanced regulatory T cell responses, suppression of inflammatory responses by macrophages, differentiation of macrophages towards an M2 phenotype, and suppression of T cell effector responses.
- H. pylori-infected T cell-specific PPARγ-deficient mouse: The gastric mucosa of genetically modified mouse lacking PPARγ in T cells is colonized with H. pylori strain 26695. PPARγ has been shown to modulate CD4+ T cell differentiation upon antigen recognition promoting regulatory responses.
- H. pylori-infected RORγt deficient mouse: The gastric mucosa of retinoic acid receptor-related orphan receptor (ROR)γt knockout mouse is colonized with H. pylori strain 26695. RORγtT is a transcription factor responsible for commitment to the T helper (Th)17 phenotype.
 ENISI Interface
ENISI Visual
The ENteric Immunity Simulator (ENISI) Visual, developed by the Center for Modeling Immunity to Enteric Pathogens (MIEP), is the first agent-based simulator for modeling and simulating gastrointestinal (GI) infections caused by immune responses to invading microbe. It is built upon Repast Symphony, an open source agent-based modeling and simulation platform. Also, it is implemented in Java language and is highly portable. We have successfully run ENISI Visual simulations on Windows, MAC, and Linux machines.
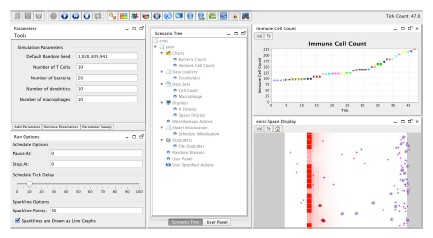
ENISI Visual provides quality visualizations for simulating gut immunity to enteric pathogens and is capable of simulating gut immunity, including pathogen invasion, pro-inflammatory immune responses, pathogen elimination, regulatory immune responses, and restoring homeostasis. Users can build their own models using it. ENISI Visual provides rich graphic user interfaces. Users can control initial cell concentrations, simulation speed, data and graphic outputs. Users can take snapshots and record videos of the simulations. ENISI Visual also simulates the secreting and diffusing of cytokines and chemokines. Each grid has a value indicating the concentrations of cytokines or chemokine and the background colors of grids changes as the values change. The visualizations can help modelers to test verify, and tune their models. The visualizations can also help immunologists to test novel hypotheses and design their biological experiments accordingly.
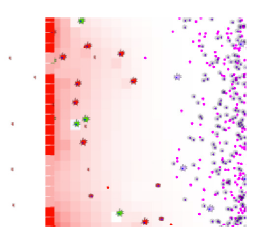
ENISI Visual has five compartments: lumen, epithelium, lamina propria, draining lymph nodes, and blood. The left figure shows three compartments: lumen is on its left side; Epithelium is the middle vertical layer; and Lamina Propria is on the right side. The gastric lymph node and blood are not shown in the visualization. Both compartments can provide immune cells during immune responses. The recruitment of immune cells is represented by the influx of immune cells from the right side of Lamina Propria.
In immune responses to pathogen invasions, the immune cells release cytokines and chemokine that are important for cell-cell communications, cell signaling, and cell movement. ENISI Visual uses a single value layer of REPAST Symphony to represent both cytokines and chemokines since they are usually secreted in parallel. We use background colors to represent the cytokine or chemokine gradient. In contacting with pathogenic bacteria, the epithelial cells become pro-inflammatory and release cytokines and chemokines. The cytokines and chemokines diffuse inside the Lamina Propria and form the gradient. Each cell has different states or phenotypes. In each simulation cycle or step, each cell checks its neighbors and its environment and determines whether it keeps its state or changes to another state. Different cell types are represented by different logos and the logos change colors when the cells change cell types. ENISI Visual has two types of movement models: random and chemotactic. Random movements are directionless and chemotactic movements follow the chemokine gradient. The movement speed is controllable and configurable.
In the following example, we developed a model using ENISI Visual. We target this model for gut immune responses to invasions of gastroenteric pathogens. This model shows how the inflammatory immune responses remove the pathogens, how the lesions are forming, and how regulatory immune responses restore the intestinal homeostasis.
References:
Yongguo Mei, Raquel Hontecillas, Xiaoying Zhang, Keith Bisset, Stephen Eubank, Stefan Hoops, Madhav Marathe, Josep Bassaganya-Riera. ENISI Visual, an agent-based simulator for modeling gut immunity. IEEE International Conference on Bioinformatics and Biomedicine (BIBM 2012). Philadelphia, PA. 2012. [Full text]
Data Figures
 ENISI Compartment
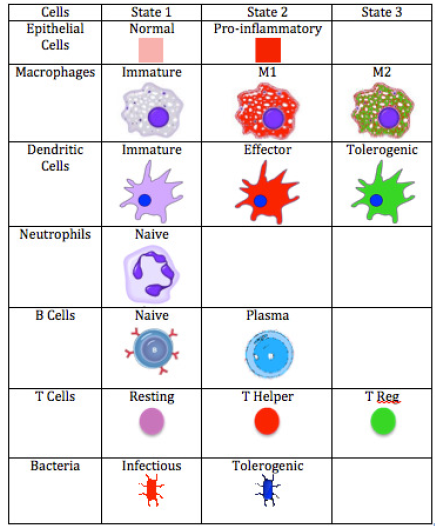 ENISI Legend
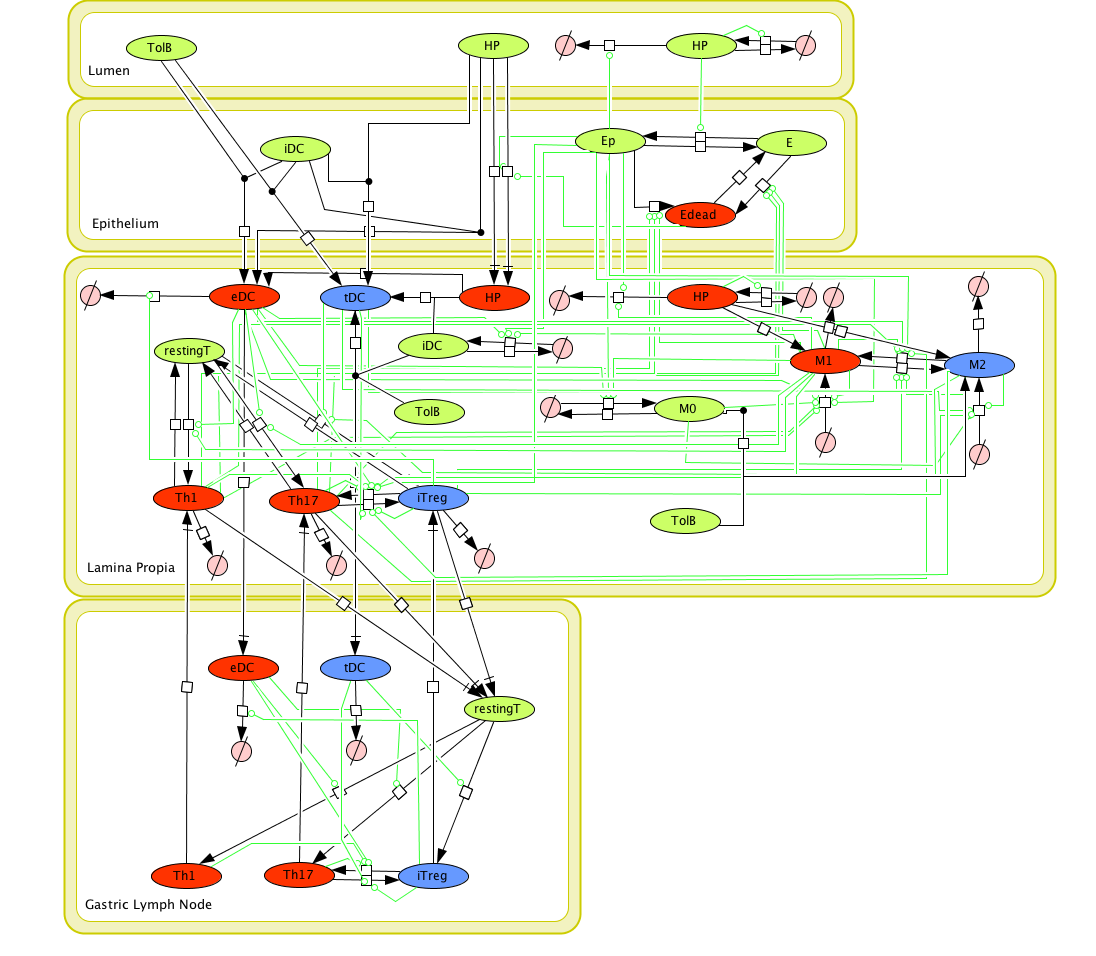 Cell Designer image: ENISI model of H. pylori
ENISI Training
The ENISI model is provided to the user as a network depiction of inflammatory and regulatory immune cell interactions with epithelial cells and bacteria in the four tissue compartments; lumen, epithelium, lamina propria, and lymph node.
In the network red nodes indicate cells that participate in the inflammatory pathways and blue indicate those in the regulatory pathways. Green nodes are cell-types that may participate in either response. Black arrows between nodes in the same tissue compartment represent differentiation from one cell-type to another. Black arrows between nodes in different compartments indicate migration from one tissue site to another. Green arrows point from cell-types to the differentiation and migration processes in which they participate. The network is created in CellDesigner, a structured diagram editor for drawing regulatory networks. MIEP uses this software to create the structural model. If you are interested in using CellDesigner to build your structural models you can download and install the program. An interactive version of the network is created with CellPublisher and provided to the user. Users can navigate through different cells types and interactions on the network and get useful information though the info windows. ENISI is a simulator of the mucosal immune pathways in a tissue sample. As a tool, ENISI allows users to modify model parameters creating a customized in silico environment in which infection dynamics can be predicted given the specific experimental conditions represented.
There are three options for viewing model predictions of outcomes given specific infection scenarios: 1. One may view the results of a simulated infections under hypothetical experimental conditions that have been pre-configured for past in silico studies at http://www.modelingimmunity.org/modeling/enisi/ Navigation and interpretation of these results are described in the tutorial video at http://www.youtube.com/watch?v=ZdNuS-G8rqo. 2. One may run own simulations setting the host immunological set point and controlling the does and time of infection with different strains using the graphical user interface. Instructions for using ENISI are give in the tutorial: http://www.youtube.com/watch?v=ZdNuS-G8rqo. 3. One may download the code and customize their in silico enviornment further by manipulating any of the 87 parameters of the middle to fit specific experimental conditions. This involves a scripting language that is described in the on-line documentation.
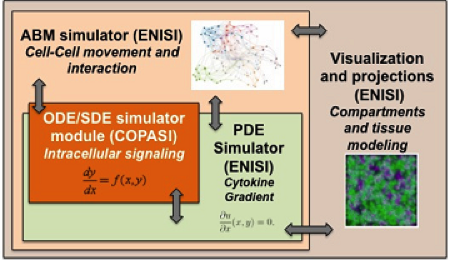 Figure 1. Software architecture of the MSM tool
Highlights
- ENISI MSM is the first multi-scale modeling platform with the ability to couple ordinary-differential equations (ODE), partial differential equations (PDE), stochastic differential equations (SDE), and agent-based modeling (ABM) models
- ENISI MSM is a user-friendly tool designed for computational biologists to process multi-scale models, converting intracellular and intercellular scales (Table 1)
- ENISI MSM model can simultaneously simulate signaling pathways, metabolic networks, gene-regulatory networks, cytokine and chemokine diffusions, cell movement, tissue compartments, including lesion formation (Figure 1)
- The MIEP team used their multi-scale CD4+ T cell differentiation model in the context of gut inflammation to display the effectiveness and usefulness of the ENISI MSM platform
- The ENISI MSM code based on Repast Simphony can checked out via SVN here
Abstract
ENISI MSM is an object-oriented multi-scale modeling (MSM) platform that can hierarchically integrate ODE-based models (COPASI [1]), PDE models, SDE models (ENISI SDE [2]) and agent-based models (ENISI Visual [3]), using user-friendly interfaces and visualizations. ENISI MSM is the first multi-scale modeling platform that can couple ODE, PDE, SDE, and ABM models together. This tool is developed in Java and is object-oriented; the agents, ODE and PDE solvers are objects. We have proposed three scale coupling techniques that are critical for performance tuning of multi-scale modeling.
Object-Oriented Implementation
ENISI MSM extensively utilizes object-oriented programming features such as encapsulations, inheritance, and polymorphism. Encapsulations: Objects can be used to encapsulate data and methods together. Many implementation details are encapsulated into objects and objects can represent a cell, a subcomponent such as an ODE sub model or a cytokine with its propagation and dispersion following PDEs (Figure 2).
Interfaces and Visualizations
Similar to ENISI Visual [3], ENISI MSM provides both terminal window outputs and graphic user interfaces. In the graphics user interfaces, the user can control the simulation settings such as initial numbers of agents and ODE file path etc. Additionally, the user can take snapshots and videos through the GUI. The terminal window provides extra text outputs for debugging the models. Figure 3 illustrates multi-scale integration of CD4+ T cell intracellular signaling networks (ODE) and gut tissue level cellular processes (ABM) using ENISI MSM.
In the multi-scale model development it is necessary to modify the single layer sub-models before coupling them together. The CD4+ T cell differential model we developed in [4] is a comprehensive intracellular ODE-based model that has 108 species, 46 reactions and 60 ODEs driving activations and inhibition pathways. If each Naive T cell is to call this ODE model to calculate its subtype and determine the cytokines it secretes, the computation will be unmanageable. For developing a multi-scale model, we reduce the model into a model with 9 species, 9 reactions, and 6 ODEs; Figure 4 displays this reduced model.
The ENISI MSM code based on Repast HPC can checkout via SVN here.
References
1) S. Hoops, S. Sahle, R. Gauges, C. Lee, J. Pahle, N. Simus, M. Singhal, L. Xu, P. Mendes, and U. Kummer. COPASI– a COmplex PAthway SImulator. Bioinformatics, 22(24):3067– 3074, Dec 2006.
2) Y. Mei, A. Carbo, R. Hontecillas, and J. Bassaganya-Riera. Enisi sde: A novel web-based stochastic modeling tool for computational biology. In Bioinformatics and Biomedicine (BIBM), 2013 IEEE International Conference on, pages 392–397, Dec 2013.
3) Y. Mei, R. Hontecillas, X. Zhang, K. Bisset, S. Eubank, S. Hoops, M. Marathe, and J. Bassaganya-Riera. Enisi visual, an agentbased simulator for modeling gut immunity. In Bioinformatics and Biomedicine (BIBM), 2012 IEEE International Conference on, pages 1–5, Oct 2012.
4) A. Carbo, R. Hontecillas, B. Kronsteiner, M. Viladomiu, M. Pedragosa, P. Lu, C. W. Philipson, S. Hoops, M. Marathe, S. Eubank, et al. Systems modeling of molecular mechanisms controlling cytokine-driven cd4+ t cell differentiation and phenotype plasticity. PLoS computational biology, 9(4):e1003027, 2013.
5) Abedi V, Hontecillas R, Hoops S, Liles N, Carbo A, Lu P, Philipson C, and Bassaganya-Riera J. ENISI Multiscale modeling of mucosal immune responses driven by high performance computing, BIBM, 2015, 2015 IEEE International Conference on Bioinformatics and Biomedicine (BIBM), 2015 IEEE International Conference on Bioinformatics and Biomedicine (BIBM) 2015, pp. 680-684, doi:10.1109/BIBM.2015.7359768
6) Mei Y, Abedi V, Carbo A, Zhang X, Lu P, Philipson C, Hontecillas R, Hoops S, Liles N, Bassaganya-Riera J. Multiscale modeling of mucosal immune responses. BMC Bioinformatics. 2015;16 Suppl 12:S2. doi: 10.1186/1471-2105-16-S12-S2. Epub 2015 Aug 25.
7) Abedi, V., R. Hontecillas, A. Carbo, C. Philipson, S. Hoops, J. Bassaganya-Riera. Multiscale Modeling: Concepts, Technologies, and Use Cases in Immunology, in Computational Immunology: Models and Tools. Editor: J. Bassaganya-Riera, Elsevier 2015.
Data Figures
-
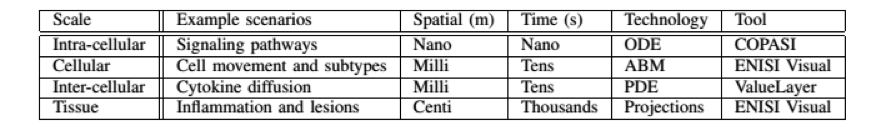 Table 1. The four scales of ENISI MSM models, their spatial and time properties, and modeling technologies
-
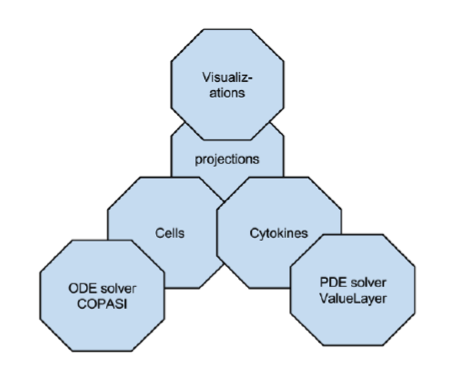 Figure 2. ENISI MSM objects
-
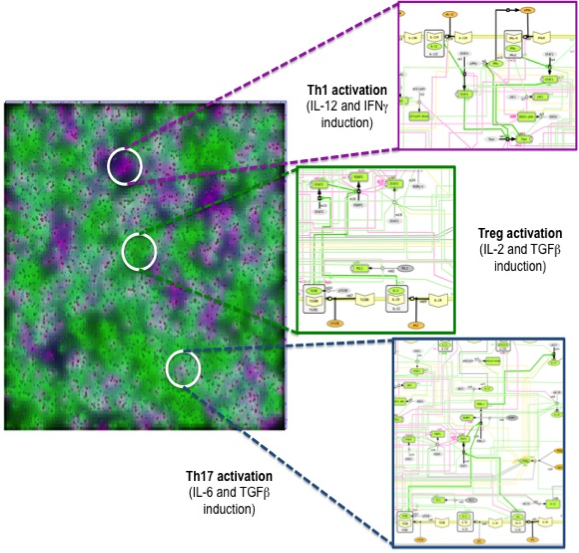 Figure 3. Multi-scale integration of CD4+ T cell intracellular signaling networks (ODE) and gut tissue level cellular processes (ABM) using ENISI
-
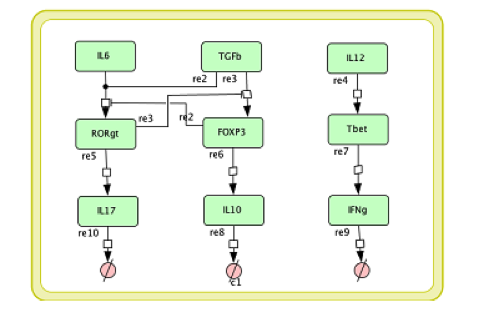 Figure 4. The simplified CD4+ T cell differentiation ODE model
Overview
Wild Type uninfected system: no changes have been made to any genes.
| Inputs specified in GUI | Result plots Click on each plot for better resolution. | ||||||||||||||||||||||||||||||||||||||||||||
|---|---|---|---|---|---|---|---|---|---|---|---|---|---|---|---|---|---|---|---|---|---|---|---|---|---|---|---|---|---|---|---|---|---|---|---|---|---|---|---|---|---|---|---|---|---|
|
| ||||||||||||||||||||||||||||||||||||||||||||
Interactive Viewer
Overview
Wild Type H. pylori infected system: this system represents immune responses towards H. pylori after infection.
| Inputs specified in GUI | Result plots Click on each plot for better resolution. | ||||||||||||||||||||||||||||||||||||||||||||
|---|---|---|---|---|---|---|---|---|---|---|---|---|---|---|---|---|---|---|---|---|---|---|---|---|---|---|---|---|---|---|---|---|---|---|---|---|---|---|---|---|---|---|---|---|---|
|
| ||||||||||||||||||||||||||||||||||||||||||||
Interactive Viewer
Overview
H. pylori infected myeloid-specific PPARg knock-out system: This system simulates a system where PPARg has been knocked out only in the myeloid subset (macrophages and dendritic cells).
| Inputs specified in GUI | Result plots Click on each plot for better resolution. | ||||||||||||||||||||||||||||||||||||||||||||
|---|---|---|---|---|---|---|---|---|---|---|---|---|---|---|---|---|---|---|---|---|---|---|---|---|---|---|---|---|---|---|---|---|---|---|---|---|---|---|---|---|---|---|---|---|---|
|
| ||||||||||||||||||||||||||||||||||||||||||||
Interactive Viewer
Overview
H. pylori infected myeloid-specific PPARg knock-out system: This system simulates a system where PPARg has been knocked out only in the myeloid subset (macrophages and dendritic cells). This is the same as scenario 3, but T cell specific.
| Inputs specified in GUI | Result plots Click on each plot for better resolution. | ||||||||||||||||||||||||||||||||||||||||||||
|---|---|---|---|---|---|---|---|---|---|---|---|---|---|---|---|---|---|---|---|---|---|---|---|---|---|---|---|---|---|---|---|---|---|---|---|---|---|---|---|---|---|---|---|---|---|
|
| ||||||||||||||||||||||||||||||||||||||||||||
Interactive Viewer
Overview
H. pylori infected RORgt null system: This system represents the response of the immune response towards H. pylori in a mouse that lacks the RORgt gene.
| Inputs specified in GUI | Result plots Click on each plot for better resolution. | ||||||||||||||||||||||||||||||||||||||||||||
|---|---|---|---|---|---|---|---|---|---|---|---|---|---|---|---|---|---|---|---|---|---|---|---|---|---|---|---|---|---|---|---|---|---|---|---|---|---|---|---|---|---|---|---|---|---|
|
| ||||||||||||||||||||||||||||||||||||||||||||
Interactive Viewer
MIEP Condor-COPASI is a distributed computing system that integrates COPASI, a biological pathway simulation tool used by MIEP, with Condor, a high-throughput computing environment. MIEP Condor-COPASI has web-based user-friendly interfaces where users need to login before submitting jobs. The backend of MIEP Condor-COPASI is a Condor Cluster implemented upon our HPC super computer Shadowfax. The jobs submitted through the Condor-COPASI web interface are queued and executed by the backend Condor cluster. The web interfaces will also show the Condor status, job status, and the simulation results as figures and tables.

To submit a new job, click ‘Tasks’ on the sidebar on the left and select one task from the task list. Currently, MIEP Condor-COPASI is capable of performing the following eight types of jobs:
- Optimization
- Stochastic Simulation
- Scan in Parallel
- Optimization Repeat
- Parameter Estimation Repeat
- Raw Mode
- Optimization Repeat with Different Algorithms
- Sigma Point Method
After submitting a job, users can monitor the status by clicking ‘My Account’ on the left sidebar. For more information, please consult the Condor-COPASI Wiki site.
Use Case Stochasticity is part of the nature of many biological processes and modeling stochasticity is an important aspect in modeling and simulations of computationalbiology. Gillespie’s algorithm was developed for modeling stochasticity for chemical reactions and has been broadly applied to stochastic modeling in computational biology. The Gillespie’s algorithm accounts for the particle effect in chemical reactions. In this example we applied the Gillespie’s algorithm to model the T helper 17 differentiation process (Figure 1). This approach is an extension of the ODE-based CD4+ T cell modeling work described in here. The CD4+ T cell differentiation model was run 10 times and data is represented as average plus SD within the same time-point, plotting IL-17A and RORgamma t.

Figure 1. Induction of T helper 17 differentiation from a naive T cell in the CD4+ T cell computational model using Gillespie algorithm. The CD4+ T cell differentiation model was induced with external IL-6 and TGF beta using the Gillespie algorithm to simulate changes in levels of IL-17, RORgamma t and IL-10. The stochastic simulation was run 100 times using the condor-COPASI. Data are represented as average and standard deviation (SD) within the 100 repeats.
The COPASI software can be found here.  CellDesigner is a structured diagram editor for drawing gene-regulatory networks. MIEP uses this software to create the structural model. If you are interested in using CellDesigner to build your structural models you can download and install the program. In addition, CellPublisher can be used to generate and publish the CellDesigner structure model onto Web using google map APIs. The CellPublisher map is interactive and user-friendly. Users can navigate through different species and reactions on the map and get useful information though the info windows. This is an example of CellPublisher models we published on our website.
 ![]() COPASI is a software application for simulation and analysis of complex intracellular networks and their dynamics. An overview of the program’s applications and abilities can be seen in this basic video tutorial. If you are interested in using COPASI for your own models, the first step is to download and install the program.
COPASI is a software application for simulation and analysis of complex intracellular networks and their dynamics. An overview of the program’s applications and abilities can be seen in this basic video tutorial. If you are interested in using COPASI for your own models, the first step is to download and install the program. ![]() The three above mentioned software packages are able to exchange the model seamlessly by using the Systems Biology Markup Language (SBML). COPASI Documentation A basic description of the steps involved in model building and analysis is available in this tutorial. The full COPASI online user manual is available, but if you are new to COPASI or modeling in general, the key steps for getting started are: 1. Understanding the GUI interface 2. Using the General Model Settings to name your model and choose units. 3. Adding Compartments, Species and Reactions to your model. 4. Using Parameter View to view and edit all parameters in one place. 5. Using Pre-Determined Reports to read your model’s output.
The three above mentioned software packages are able to exchange the model seamlessly by using the Systems Biology Markup Language (SBML). COPASI Documentation A basic description of the steps involved in model building and analysis is available in this tutorial. The full COPASI online user manual is available, but if you are new to COPASI or modeling in general, the key steps for getting started are: 1. Understanding the GUI interface 2. Using the General Model Settings to name your model and choose units. 3. Adding Compartments, Species and Reactions to your model. 4. Using Parameter View to view and edit all parameters in one place. 5. Using Pre-Determined Reports to read your model’s output.
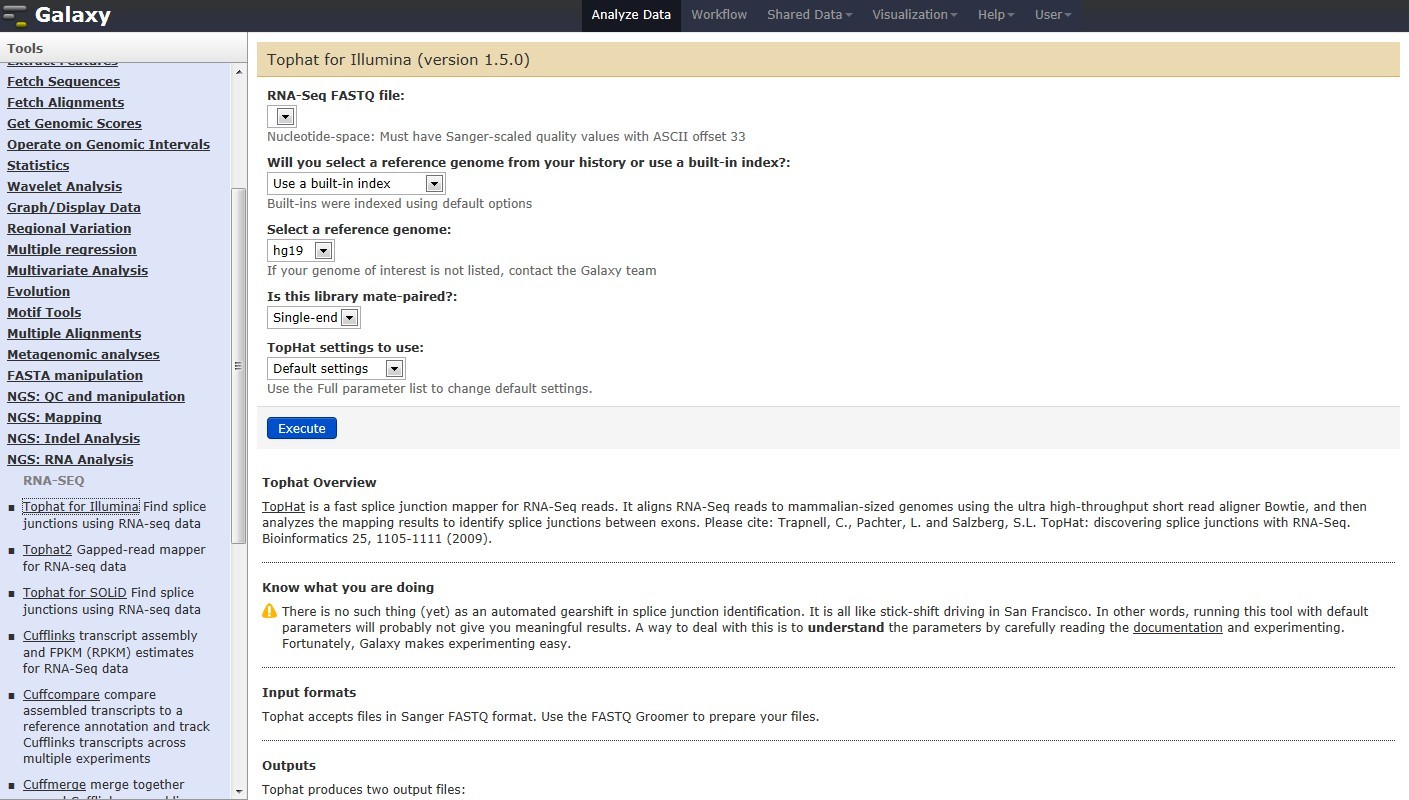 Figure 1. Galaxy RNA-seq Pipeline Screenshot.
Highlights
- Shadowfax, a hybrid cluster with 912 processor cores, 5.4 TB of RAM, 40Gb/s InfiniBand network, 80TB parallel storage, 16 nVidia Tesla GPGPUs (7168 CUDA cores) and 3 FPGA based Convey HC-1 systems
- ENISI agent-based models run in Shadowfax and can scale up to 10^8 cells
- Condor Copasi runs in Shadowfax and performs task such as parameter estimation and parameter scanning in parallel
- RNA seq analysis with Galaxy local instance installed on Shadowfax
Galaxy Overview
Galaxy captures information so that any user can repeat and understand a complete computational analysis. Users also share and publish analysis via the web and create Pages, interactive, web-based documents that describe a complete analysis. Galaxy’s public service web site makes analysis tools, genomic data, tutorial demonstrations, persistent workspaces, and publication services available to any scientist. Extensive user documentation is freely available. Galaxy is open source for all organizations.
Transcriptome Sequencing (RNA-seq Pipeline)
As part of the MIEP program, we have developed an automated RNA-seq pipeline supported by a 96-core (Intel) cluster (Shadowfax), 64-bit, with 386 GB memory, and 60TB of shared Panasas PAS7 disk space already assembled at Virginia Bioinformatics Institute (VBI) (Figure 2). The cluster is a hybrid platform consisting of a combination of nodes with typical 64 bit Intel processors, nodes with very large shared memory, General Purpose Graphic Processing Units (GPGPUs) and Field Programmable Gate Arrays (FPGAs). All of these systems have access to a shared high throughput and low latency network fabric, based on 40Gbps InfiniBand technology. For storage, a pair of SGI InfiniteStorage 16000 systems delivers half a PetaByte of capacity. The core platform has a dedicated set of 64 bit servers, based on Dell cloud computing platform C6100. In addition to the eight-compute nodes, the core is able to burst to the entire Shadowfax cluster.
Shadowfax cluster is maintained under a condo computing model and it is owned in part by the MIEP program. While VBI IT CCF maintains the system and funds the network infrastructure, storage systems, software and all the other required components, researchers purchase compute nodes and additional storage capacity. Under this plan, users have exclusive access to their respective systems, and advanced queuing system assures their availability. At the same time, their submitted jobs can take advantage of any unused compute resources. Ultimately, the cluster provides a very affordable computing platform for its users, while capitalizing on available hardware, cooling and power. We used this cluster to created the Shadowfax RNA-seq pipeline. The overarching goal of MIEP is to understand the mechanisms of action underlying cell processes in infectious disease of gut pathogens. The creation of computational models to elucidate these processes needs a significant amount of data. MIEP is developing a system to integrate RNAseq data into calibration databases for parameter estimation processes. Given a system of differentially expressed genes, MIEP aims to use the dataset as a quantitative input during the modeling process.
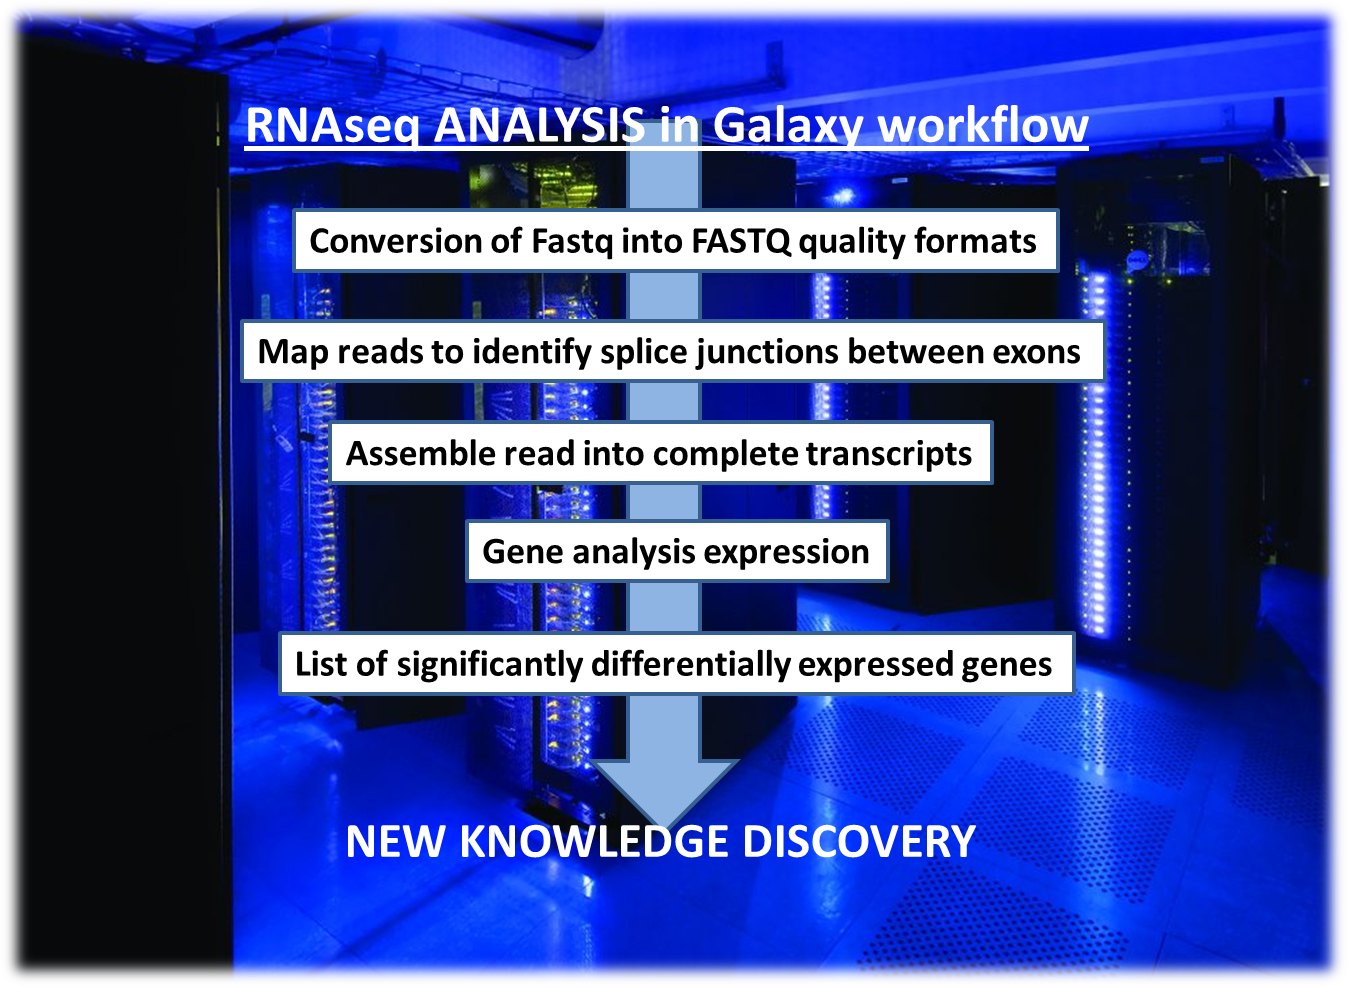 Figure 2. Galaxy workflow to complete analysis of RNAseq data for gene profiling and pattern of differentially expressed genes.
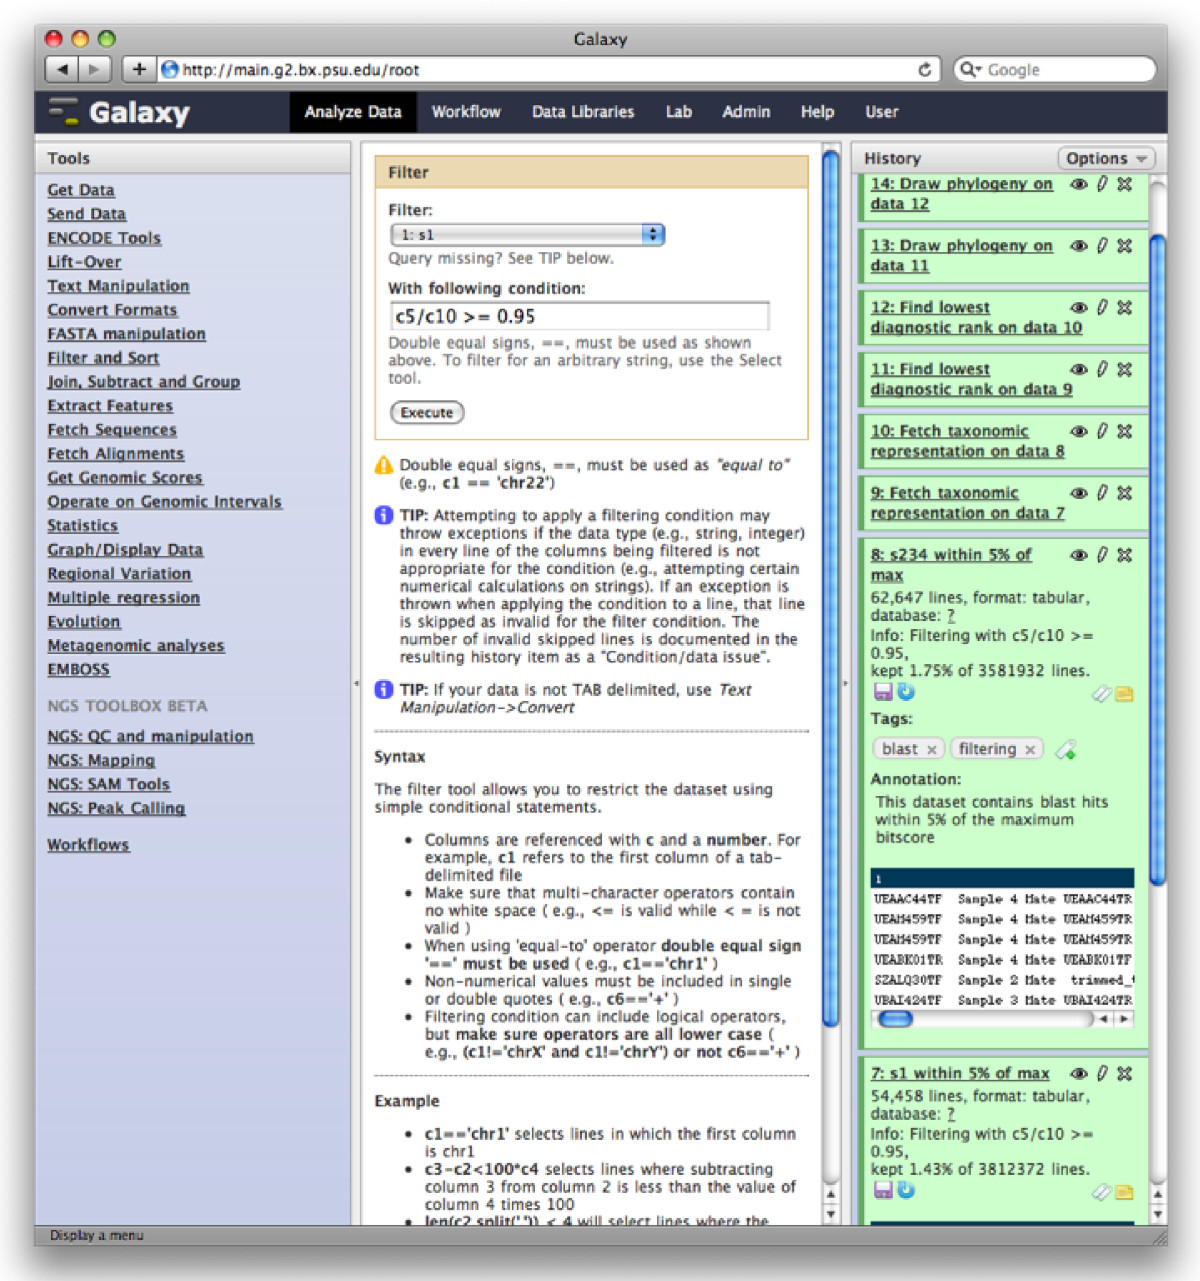 Galaxy Analysis Workspace
Galaxy Training
The purpose of this page is to serve as an introduction on how to use Galaxy for modeling immunity. The information about MIEP Galaxy is available here. To access the local instance of Galaxy powered by MIEP’s HPC systems please click here.
The Galaxy analysis workspace is where users perform genomic analyses. The workspace has four areas: the navigation bar, tool panel (left column), detail panel (middle column), and history panel (right column). The navigation bar provides links to Galaxy’s major components, including the analysis workspace, workflows, data libraries, and user repositories (histories, workflows, Pages). The tool panel lists the analysis tools and data sources available to the user. The detail panel displays interfaces for tools selected by the user. The history panel shows data and the results of analyses performed by the user, as well as automatically tracked metadata and user-generated annotations. Every action by the user generates a new history item, which can then be used in subsequent analyses, downloaded, or visualized. Galaxy’s history panel helps to facilitate reproducibility by showing provenance of data and by enabling users to extract a workflow from a history, rerun analysis steps, visualize output datasets, tag datasets for searching and grouping, and annotate steps with information about their purpose or importance.
There are a series of video tutorials available in here, covering many aspects of Galaxy, from simple tasks like uploading data, to complex analysis. The following is a brief introduction of Galaxy.

Link
Galaxy can be accessed by clicking here.
Account
A user account is required to access MIEP Galaxy for security reasons. If you do not have an account and want to try our Galaxy, please contact Dr. Josep Bassaganya-Riera (jbassaga@vbi.vt.edu), the Director of MIEP program and NIMML.
LabKey is a web-based platform designed for translational research teams. The NIMML uses a customized version of LabKey as its internal electronic notebook and laboratory management information (LIMS) system for real time data-acquisition, data analysis, collaboration, and for publication of raw and processed data.

Research Electronic Data Capture (REDCap) is a web-based application designed to build and manage online surveys and databases. The NIMML uses this tool for clinical and research project management to communicate surveys and data with collaborators.

External Links
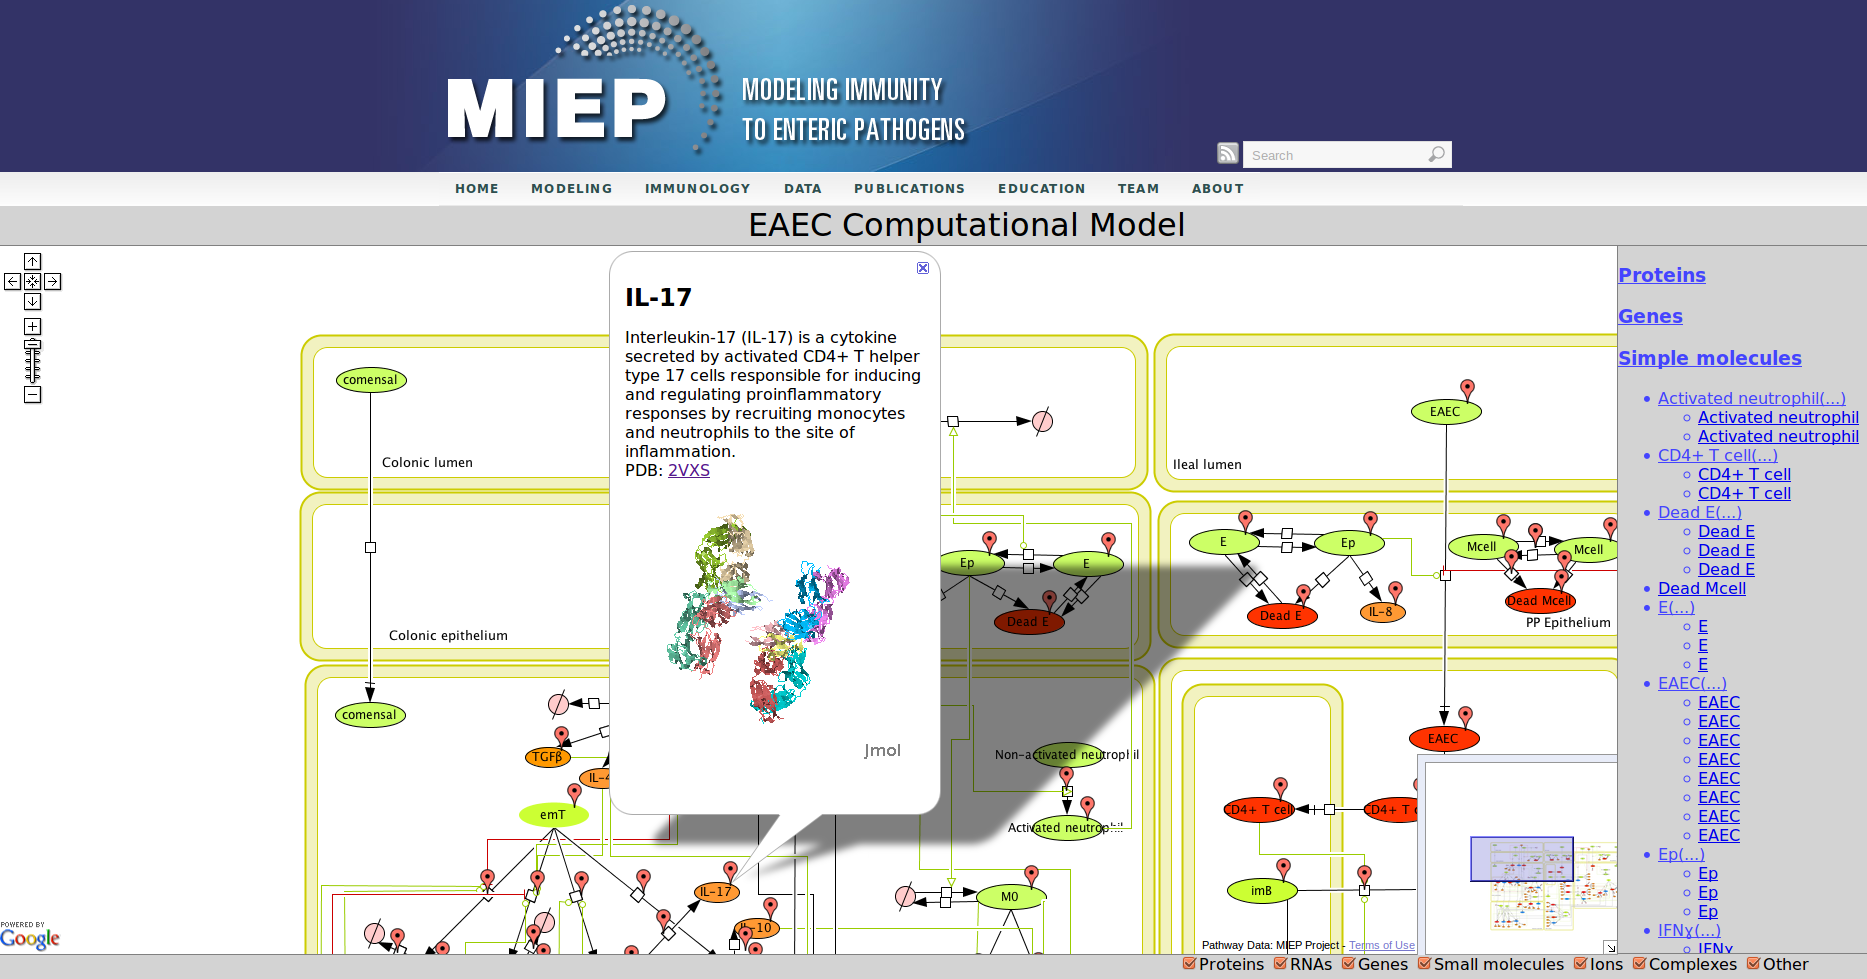 Enteroaggregative Escherichia coli (EAEC) Model
Overview
CellPublisher is a free and open source program to make highly interactive representations of biochemical processes. It converts a file in the Systems Biology Markup Language (SBML) created with the popular modeling tool CellDesigner into an interactive Web application, which allows the user to explore the model and access detailed explanations of the model component enhanced with references to scientific publications, experimental data and modeling results. MIEP makes use of CellPublisher to disseminate the models developed in the program to the scientific community in a user friendly way.
Our Bioinformatics Team at the Nutritional Immunology and Molecular Medicine Laboratory and MIEP incorporated three major enhancements to CellPublisher. These improvements allow annotating reactions in addition to species, thereby allowing scientists to convey more information about the interactions in their models. The Google map markers are only shown for objects, which have been annotated. It is immediately visible to the user where information is available. This behavior is similar to the road maps one sees in Google. Another improvement is that the capability to display 3D protein structures through JMol has been enhanced by making it compatible with all major Web browsers on common operating systems. We also reduced the size of annotation markers so that they do not interfere with the network information conveyed through the graphic representation of the model.
The CellPublisher source code which we are using to create the annotated interactive model networks found on the is site is available via the NIMML Subversion repository. The enhancement can be retrieved directly from the repository with:
svn co https://www.nimml.org/svn/nimml-analysis/cellpublisher/trunk